Overview
Understanding your proxy and session usage is essential for optimizing costs, managing quotas, and ensuring efficient automation. Browserbase provides multiple ways to track and analyze usage, including a dashboard overview, the Project Usage API, and session metadata for granular insights.Browserbase Dashboard
The Browserbase Analytics Dashboard provides a real-time view of your session activity, browser usage, and proxy data consumption. It helps you monitor performance, track trends, and optimize automation workflows at a glance.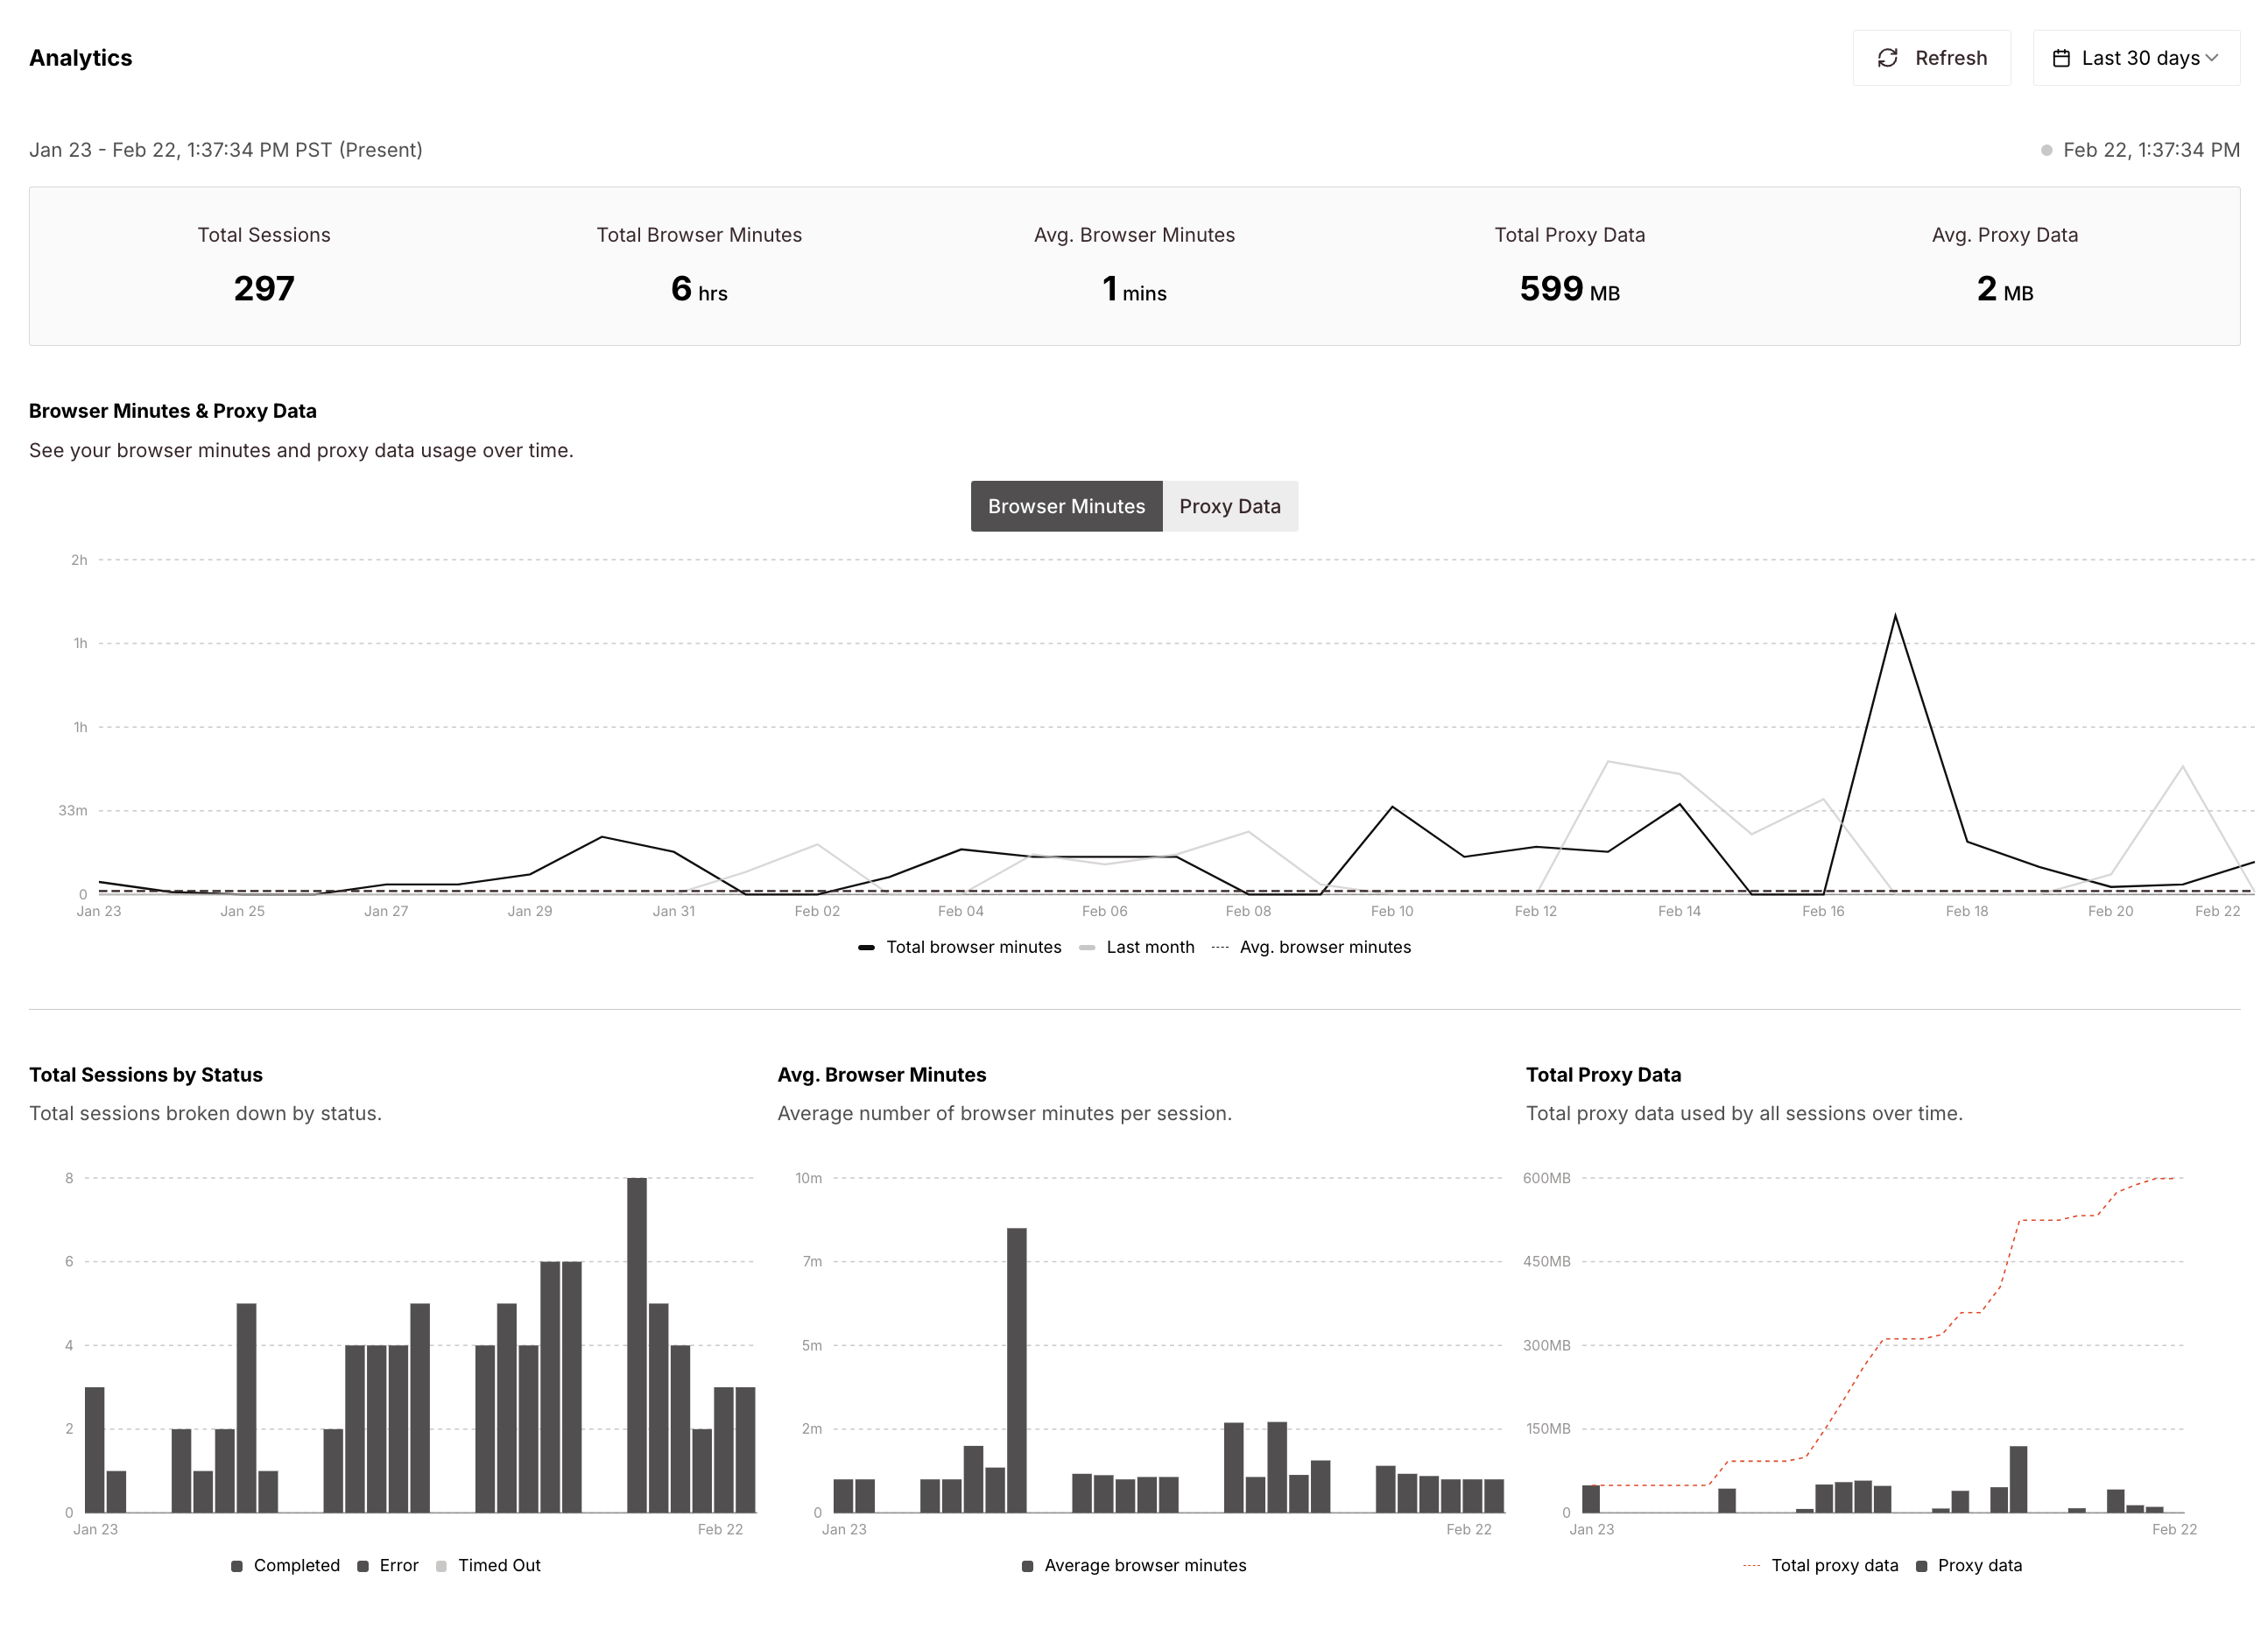
Features
- Customizable Time Range: View data for the last 24 hours, 7 days, 30 days, or your billing cycle to analyze trends over different periods.
- Real-Time Refresh: Update your analytics with the latest data instantly.
- Detailed Metrics on Hover: Hover over charts to see precise session, proxy, and usage details.
Metrics
- Total Sessions & Browser Minutes: Track session volume and total runtime.
- Avg. Session Duration & Proxy Data: Monitor efficiency and bandwidth usage.
- Session Status Breakdown: Identify errors, timeouts, and completion rates.
Using the Project Usage API
For programmatic tracking, the Project Usage API allows you to retrieve detailed usage data through an API request. This is useful for:- Automating usage reports to monitor trends over time.
- Setting up alerts when usage approaches a predefined limit.
- Integrating with external billing or monitoring tools for cost control.
- Node.js
- Python
Tracking Function Invocations: Functions automatically create sessions that appear in your usage metrics. Use session metadata in your function’s
sessionConfig to segment and track function invocations alongside regular sessions.Segmenting Usage with Metadata
To segment usage by metadata, you can add metadata to your sessions. This metadata is stored in the session metadata field and can be used to segment usage in the Browserbase Dashboard. Find more information in the Session Metadata documentation.- Create a session with metadata
- Query the session usage data with the metadata
Create a session with metadata
Session metadata allows you to tag and categorize sessions for better tracking, segmentation, and analysis. By adding metadata, you can:- Filter and analyze usage by project, client, or workflow.
- Track performance and debugging data across different runs.
- Segment sessions based on region, proxy settings, or automation type.
- Labeling sessions by client (“client”: “enterprise_customer_xyz”)
- Tagging workflow type (“task”: “checkout_automation”)
- Storing region or proxy details (“region”: “us-west”)
- Debugging with test IDs (“test_id”: “A/B-variant-3”)
- Node.js
- Python
Query the session usage data with the metadata
You can filter and analyze session usage by querying sessions based on their metadata. This allows you to track specific workflows, clients, or regions to gain insights into usage patterns, optimize automation, and manage costs effectively. By using metadata filters, you can:- Retrieve sessions by client, project, or task type to analyze usage trends.
- Segment usage based on region, proxy settings, or session status.
- Identify high-bandwidth sessions by tagging and filtering resource-heavy processes.
Note that we need to URL encode the query string to ensure that it’s properly parsed by the API.
%5Bis the URL encoded version of[%5Dis the URL encoded version of]%3Ais the URL encoded version of:
encodeURIComponent("user_metadata['order']['status']:'shipped'") to encode the query string.- Node.js
- Python