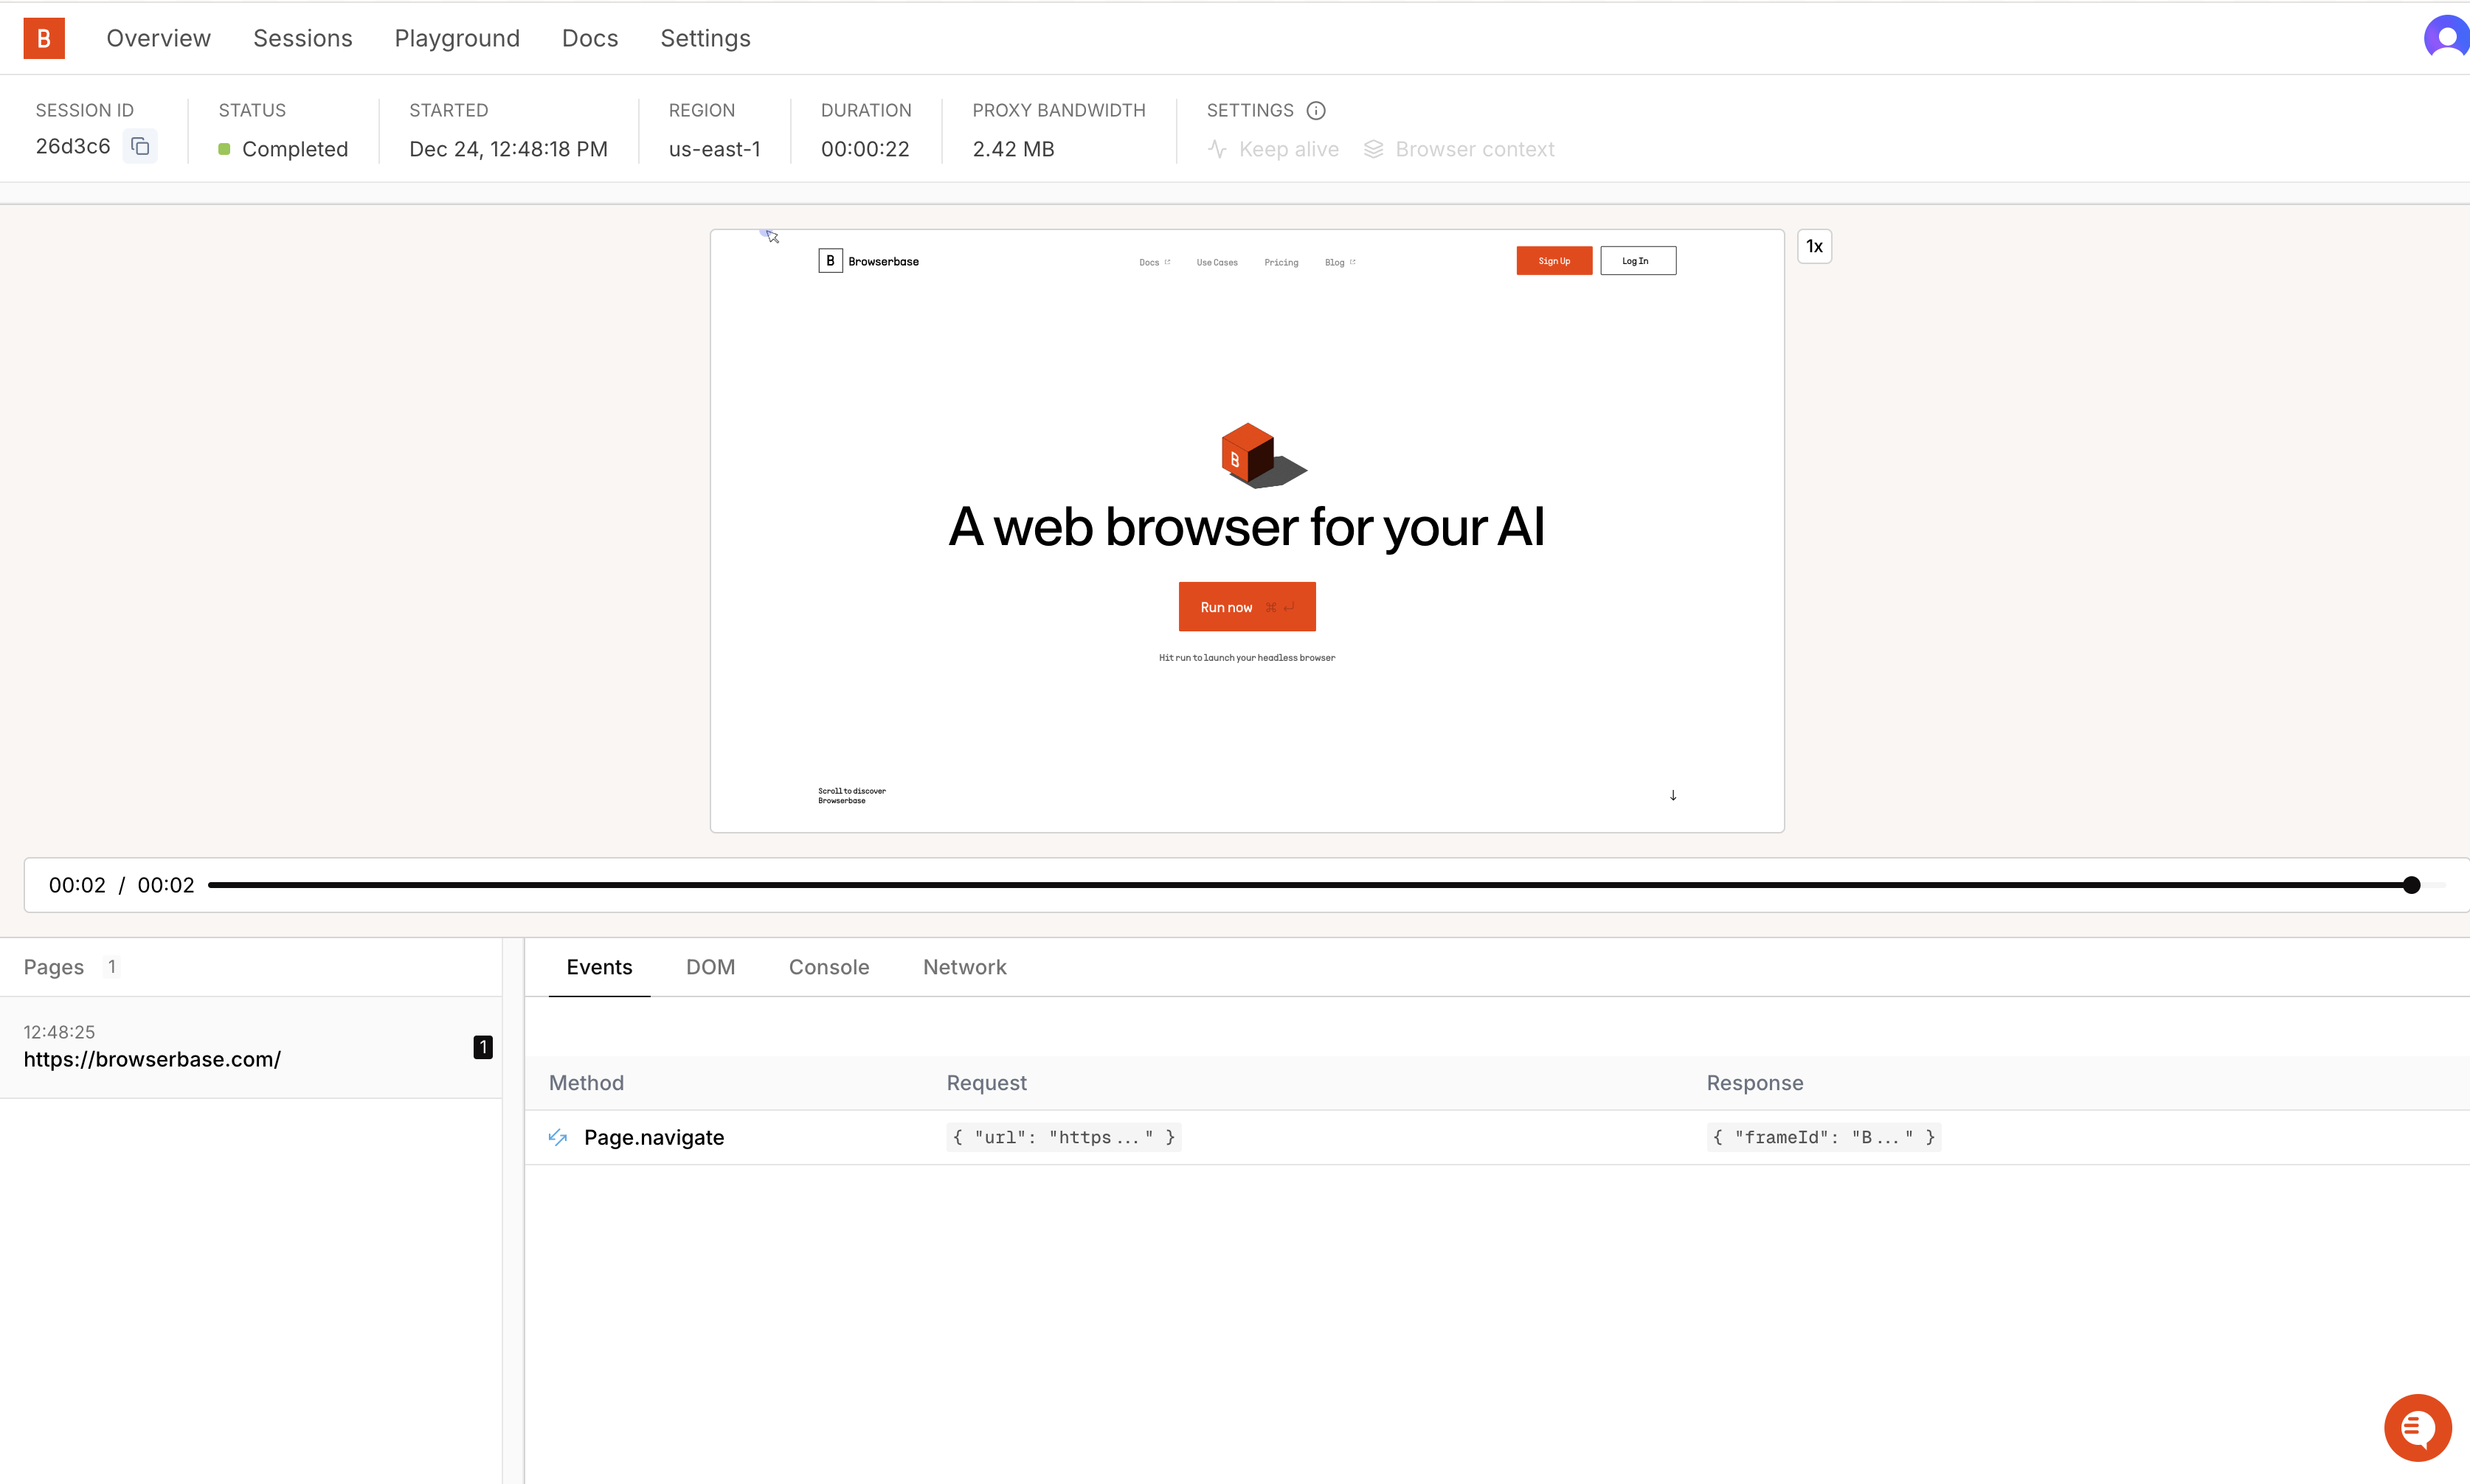
New: Browserbase now uses video-based session recordings instead of DOM-based replays. Session recordings capture up to 10 tabs as separate video streams, providing more reliable playback and better support for dynamic content. This replaces our previous RRWeb implementation. Read more here.

Overview

Session Recordings are one of the most powerful features of Browserbase. It allows you to record a Session to inspect the actions performed and network requests, page by page. To learn more about how Session Recordings works, we’ll walk through a quickstart guide to understand how Session Recordings can be involved in your development workflow. Let’s get started in viewing your first session recording immediately.

Install the Browserbase SDK

npm install @browserbasehq/sdk tsx

Create your script to record a session and view the recording

Use your ideal framework to connect to a Browserbase session, navigate to the page you want to record, and then close the session.
import { chromium } from "playwright-core";
import Browserbase from "@browserbasehq/sdk";

if (!process.env.BROWSERBASE_API_KEY || !process.env.BROWSERBASE_PROJECT_ID) {
  throw new Error("Missing required environment variables");
}

const BROWSERBASE_PROJECT_ID = process.env.BROWSERBASE_PROJECT_ID;
const BROWSERBASE_API_KEY = process.env.BROWSERBASE_API_KEY;

const bb = new Browserbase({
  apiKey: BROWSERBASE_API_KEY,
});

(async () => {
  // Create a new session
  const session = await bb.sessions.create({
    projectId: BROWSERBASE_PROJECT_ID,
  });

  // Connect to the session
  const browser = await chromium.connectOverCDP(session.connectUrl);

  // Getting the default context to ensure the sessions are recorded.
  const defaultContext = browser.contexts()[0];
  const page = defaultContext?.pages()[0];

  // Navigate to the Browserbase docs and wait for 10 seconds
  await page.goto("https://docs.browserbase.com/introduction");
  await page.waitForTimeout(10000);
  await page.close();
  await browser.close();

  // Log the session recording URL
  console.log(
    `Session complete! View recording at https://browserbase.com/sessions/${session.id}`,
  );
})().catch((error) => console.error(error.message));

Run the script

npx tsx index.ts
You should see this output in your terminal:
Session complete! View recording at https://browserbase.com/sessions/${session.id}

Session Recording and Metrics

A recording of each Session is featured in the Sessions page. This recording is a video recording of the session and can be inspected with your Chrome DevTools.
Here are some key takeaways:
  • A high usage of memory or CPUs might result in longer runs and more billed minutes. Look at the logs or open a Live Session URL to pinpoint the root issue.
  • In case of high proxy bandwidth usage, inspect the network requests using the Timeline described below.

DOM

The DOM tab shows a live representation of the webpage’s HTML structure during the session. You can inspect the Document Object Model DOM to see the exact state of elements, their attributes, and how they’re nested within the page.

Console Logs

Logs emitted by the Web Console API (ex: console.log()), making debugging remote Sessions as easy as using your browser
Some example of console logs:
  • browser-solving-started
  • browser-solving-completed
  • browserbase-keeping-connection-alive
  • Starting recording
You’ll also be able to see other logs as expected from a browser, like [DOM] Updated style of [body] or [Network] Request finished loading: GET "https://example.com/style.css"

Network Events

Network events (Network), describing in detail any network requests and responses performed during Session The Timeline also features logs emitted by the Web Console API (ex: console.log()), making debugging remote Sessions as easy as using your browser.
Logs can also be retrieved using the Sessions API for automated processing.

HAR Recording

HAR (HTTP Archive) files capture detailed network activity during your browser sessions. You can record HAR files using Playwright’s tracing feature, which provides comprehensive network data that can be analyzed or replayed.

Recording HAR Files

To record network activity as HAR data, use Playwright’s tracing functionality:
Playwright
import { chromium } from "playwright-core";
import Browserbase from "@browserbasehq/sdk";

const PROJECT_ID = process.env.BROWSERBASE_PROJECT_ID;
const API_KEY = process.env.BROWSERBASE_API_KEY;

const bb = new Browserbase({
  apiKey: API_KEY,
});

const session = await bb.sessions.create({
  projectId: PROJECT_ID,
});

console.log("Starting remote browser...");
const browser = await chromium.connectOverCDP(session.connectUrl);
const defaultContext = browser.contexts()[0];
const page = defaultContext.pages()[0];

// Start HAR recording using routeFromHAR
console.log("Starting HAR recording...");
const harFile = `recording-${Date.now()}.har`;
await defaultContext.routeFromHAR(harFile, {
  url: "**/*",
  update: true,
  updateContent: "embed",
  updateMode: "full"
});

// Also start tracing to capture network activity locally
await defaultContext.tracing.start({
  screenshots: true,
  snapshots: true,
  sources: true
});

await page.goto("https://news.ycombinator.com/", {
  waitUntil: "domcontentloaded",
});

// Navigate to additional pages to capture more network data
await page.click('a[href*="item"]');
await page.waitForLoadState("domcontentloaded");
await page.goBack();
await page.waitForLoadState("domcontentloaded");

// Stop tracing and save the trace file
const traceFile = `trace-${Date.now()}.zip`;
await defaultContext.tracing.stop({ path: traceFile });
console.log(`Trace file saved as: ${traceFile}`);

await page.close();
await browser.close();

console.log(`HAR file saved as: ${harFile}`);
console.log(`Session complete! View replay at https://browserbase.com/sessions/${session.id}`);

Analyzing HAR Files

The trace file contains network activity that can be viewed and analyzed:
  1. View in Playwright Trace Viewer: Use npx playwright show-trace trace-file.zip to view the captured network activity
  2. Extract Network Data: The trace file contains detailed network requests, responses, and timing information
  3. Replay Network Activity: Use the HAR data to replay network interactions for testing and debugging

Understanding HAR Data

HAR files capture:
  • Network Requests: All HTTP requests made during the session
  • Response Data: Complete response bodies and headers
  • Timing Information: Detailed timing for each network operation
  • Performance Metrics: Network performance and loading times
When using Browserbase’s remote browsers, HAR files created with routeFromHAR are stored on the remote instance. Use tracing to capture network data locally for analysis.

Session Logs

Session logs contain detailed information captured during a Browserbase session. This includes browser events, network requests, and other runtime data. These logs provide insights into what occurred during the session’s execution. To retrieve the logs of a session, you can use the Sessions API or the logs.list() method in the Browserbase SDK.
// Get the session logs for the given session id
const logs = await bb.sessions.logs.list(session.id);
console.log(logs);
These logs retrieved using the Browserbase SDK are the same as the ones featured in the Events tab of the Session Recording.

Session Recordings

Session recordings provide a representation of the session’s data, unique id, timestamp, and type of session.

Retrieve Session Replays

Let’s say you have a session ID and you want to retrieve the replays for that session. You can do so by using the recording.retrieve() method in the Browserbase SDK.
The retrieve method returns the session recording events, which can be used to replay the session. This uses the rrweb player to replay the session, this does not work with video recordings.
// Get the session replay for the given session id
const rrwebEvents = await bb.sessions.recording.retrieve(session.id);
console.log(rrwebEvents);
Often times, you’ll want to integrate a recording player in your application. This is a simple process that can be done in a few steps. Since session recordings are a culmination of rrweb events captured during the session, you can integrate a recording player into your application to replay these events.

Using the rrweb Player Component

If using a frontend framework like Next.js, you can use the rrwebPlayer component for displaying the session replay in your application. You can create a reusable component that accepts session recording events as props and renders the rrweb player:
import rrwebPlayer from "rrweb-player";
import "rrweb-player/dist/style.css";

// Initialize the player with your session recording
new rrwebPlayer({
  target: document.body,
  props: {
    events: recording.events,
    width: 1024,
    height: 576,
  },
});

Using an Iframe Container

You can embed the recording player in an iframe:
<iframe
  src="/replay/${sessionId}"
  width="100%"
  height="600px"
  frameborder="0"
  allow="fullscreen"
></iframe>
The iframe approach requires you to host a separate page that initializes the rrweb player. Make sure to handle proper session authentication and access control.

Working with Session Events

You can use the events prop to pass session recording events to the rrweb player:
import rrwebPlayer from "rrweb-player";
import "rrweb-player/dist/style.css";

new rrwebPlayer({
  target: document.body,
  props: {
    events: recording.events,
    width: 1024, // Player width in pixels
    height: 576, // Player height in pixels
    skipInactive: true, // Skip inactive time periods
    showController: true, // Show playback controls
    autoPlay: false, // Start playing automatically
  },
});
The player emits events you can listen to, including ‘play’, ‘pause’, and ‘finish’ events that help you track the playback state:
const player = new rrwebPlayer({
  target: document.body,
  props: { events: recording.events },
});

player.addEventListener("play", () => console.log("Started"));
player.addEventListener("pause", () => console.log("Paused"));
player.addEventListener("finish", () => console.log("Finished"));

// Control playback
player.goto(5000); // Jump to 5 seconds
const currentTime = player.getCurrentTime();
Always be sure to destroy the player when it is no longer needed:
player.destroy();

Multitab Workflows

Session recordings can record up to 10 tabs. Each tab is recorded separately and can be viewed individually in the Session Inspector.
For workflows requiring more than 10 tabs, we recommend using Live View for real-time debugging, or capturing screenshots as you go.

Debugging Recordings

Video Recordings

Session Recordings are video recordings captured during your session.
Session recordings support up to 10 tabs. Each tab is recorded separately and can be viewed individually in the Session Inspector.

Debugging Options

If the session did not record properly, two options are:
  1. Run the session again
  2. Use our Live View for real-time debugging
Other helpful points to keep in mind while debugging:
  • Recordings are available about 30 seconds after session close
  • Recordings are disabled on a few sites, like Opentable and the Salesforce family of sites
Questions or stuck? Contact us anytime at support@browserbase.com 🅱️