Uses
While Browserbase helps with anti-bot mechanisms, scraping, and reliable file downloads among other features, some scenarios remain challenging to fully automate for technical or data-privacy reasons. Live Views can be useful for:- Debugging and observability - watch everything happening live, or share with users or coworkers
- Human in the loop - instantly take control or provide input
- handle iframes - loaded content might be external or could change without notice, potentially leading to error conditions without human intervention
- delegate credentials - give control to the end user
- upload files - see our uploads guide for how to enable uploads through the live view
- Embedding - use within an application (both desktop and mobile)
Getting Started
Need help getting started? Check out our Create a Browser Session and Using Browser Sessions guides.
Multitab
Each tab has a unique live view url. Thepages property contains all live view urls.
We recommend listening to the Playwright new tab event (or equivalent in other libraries) to trigger a request to get new live view urls when needed.
Embedding
In the frontend of your application, add the live view link to an iframe to embed it.Mobile
Show a mobile live view by setting a session’s viewport.Mobile keyboards are not officially supported. Desktop works natively, but for mobile you’ll need to handle key events and send them to your automation script (like via HTTP or WebSocket). Once there, call
page.keyboard.press() to forward them into the session.Some virtual keyboard keys need to be mapped to your framework’s key names (e.g. {ent} → "Enter"). You may need to override keys like Tab so they’re sent to the session and not processed by the local browser.Handling Disconnects
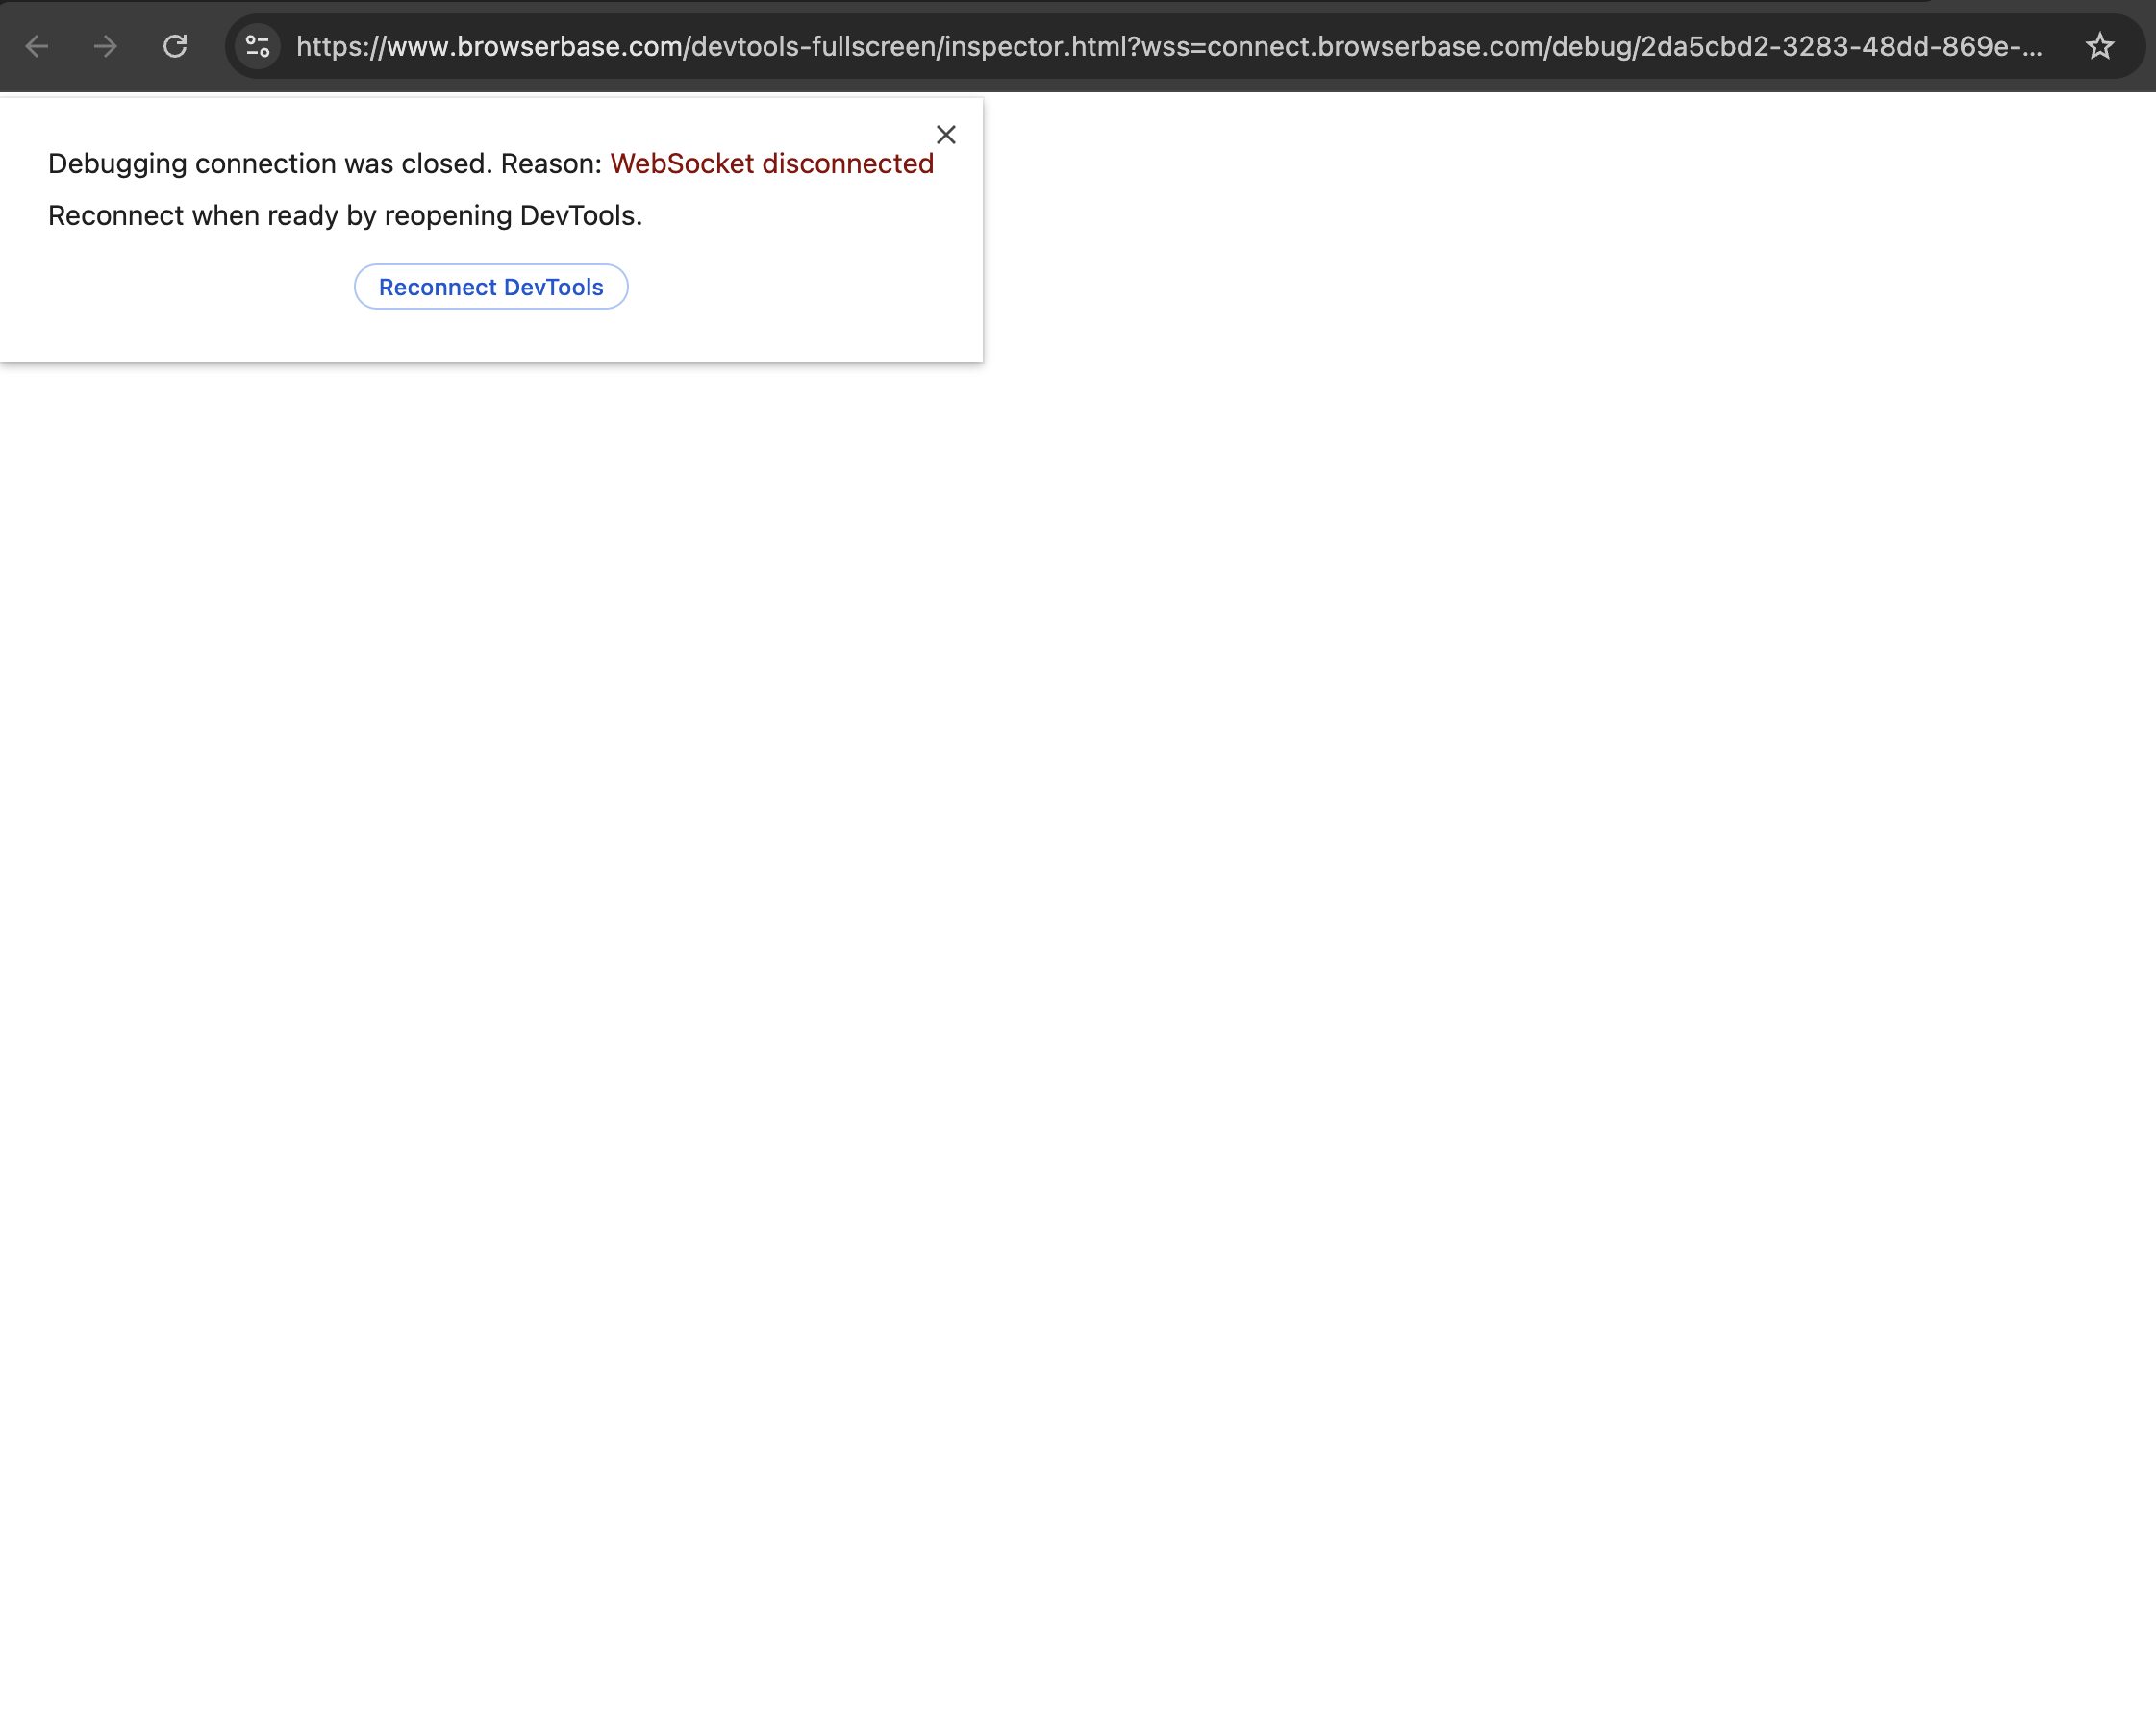
When the browser session ends, the live view will show a disconnect message:
Styling
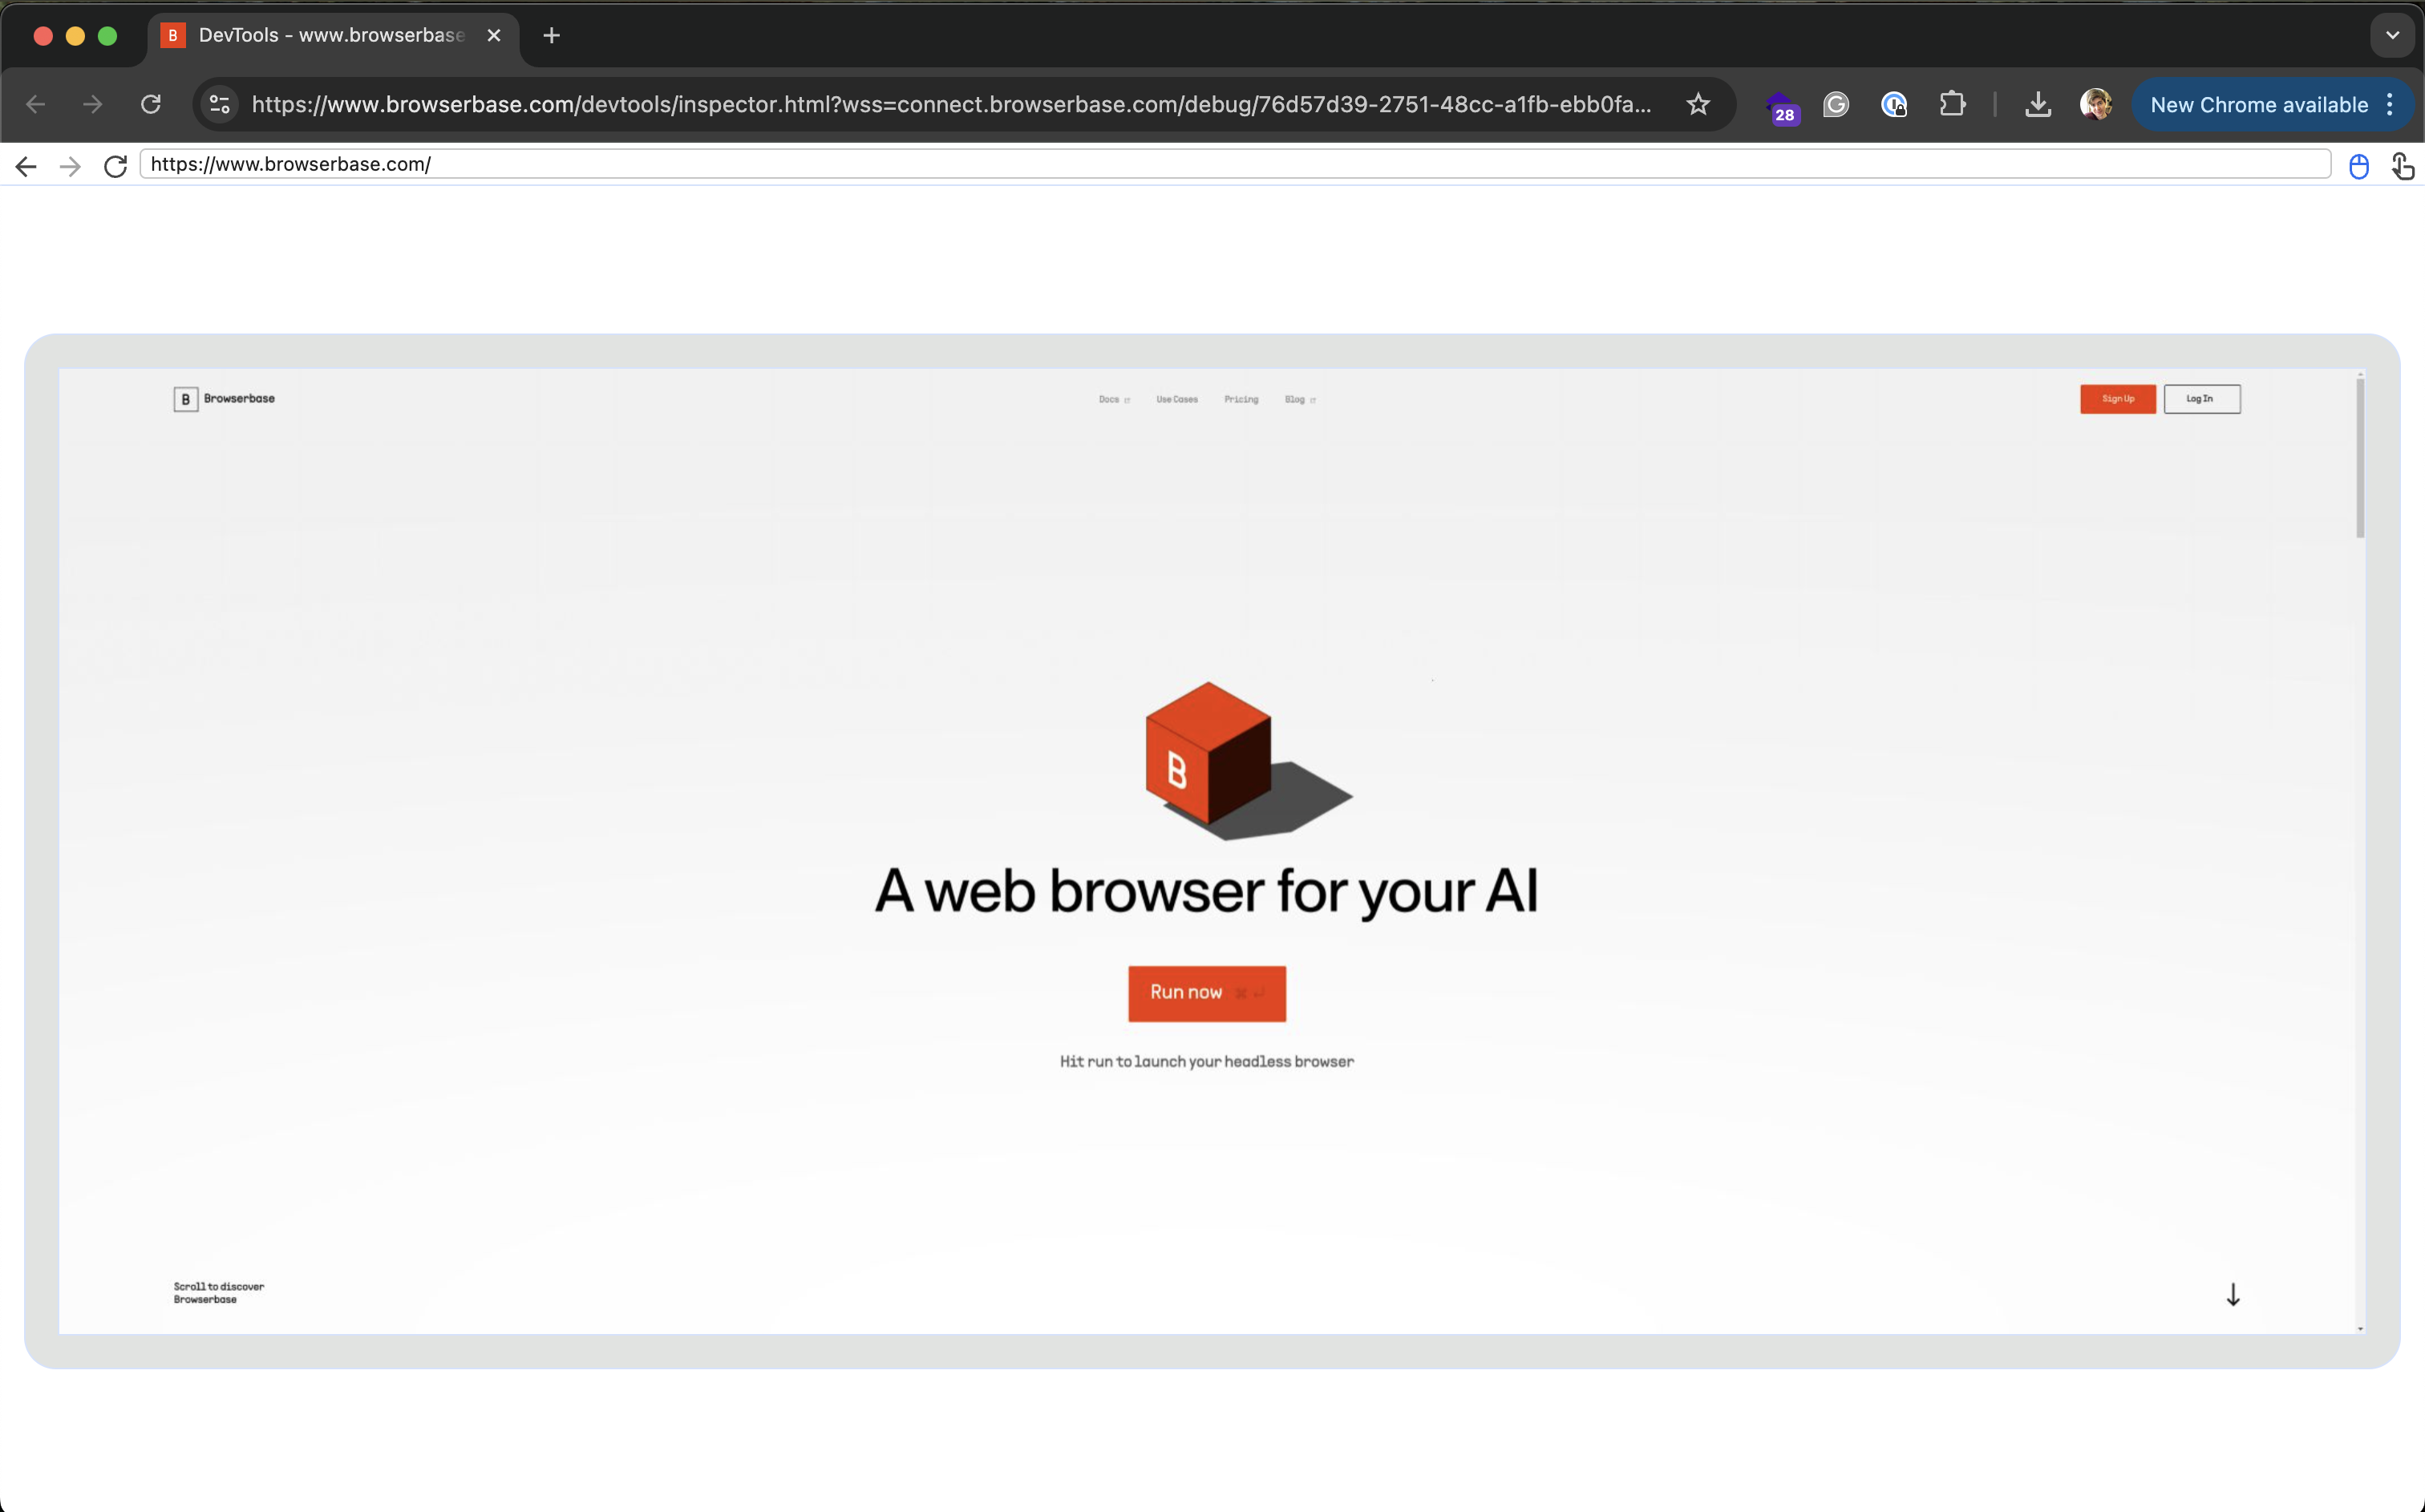
Browser with Borders
Mimic a real browser with borders.
Hide the Navbar
The live view includes a navbar at the top, for additional context and navigation control. To maximize the visible area, or for integrating with a UI that already provides context, you can hide the navbar.Hide the Scrollbar
- JavaScript
- Python
Troubleshooting
- Blank or Empty Window You may be on another tab. Check if there are multiple tabs open via the web session inspector or the pages list.
- Lag Check out our performance guide.
-
Looks Off
Often caused by headless browser rendering differences. Some issues may be fixable by adjusting CSS styling through
page.evaluate(). -
Lost Connection
If the live view loses its connection to the browser, the iframe will post a
browserbase-disconnectedmessage. See Handling Disconnects for how to listen for this event.